Observability and monitoring products
Metrics, traces and event streams presented to operators.
Dashboard & operations templateObservability
An operations console with metrics, time windows, event rows and actions — the screen an operator keeps open all day.
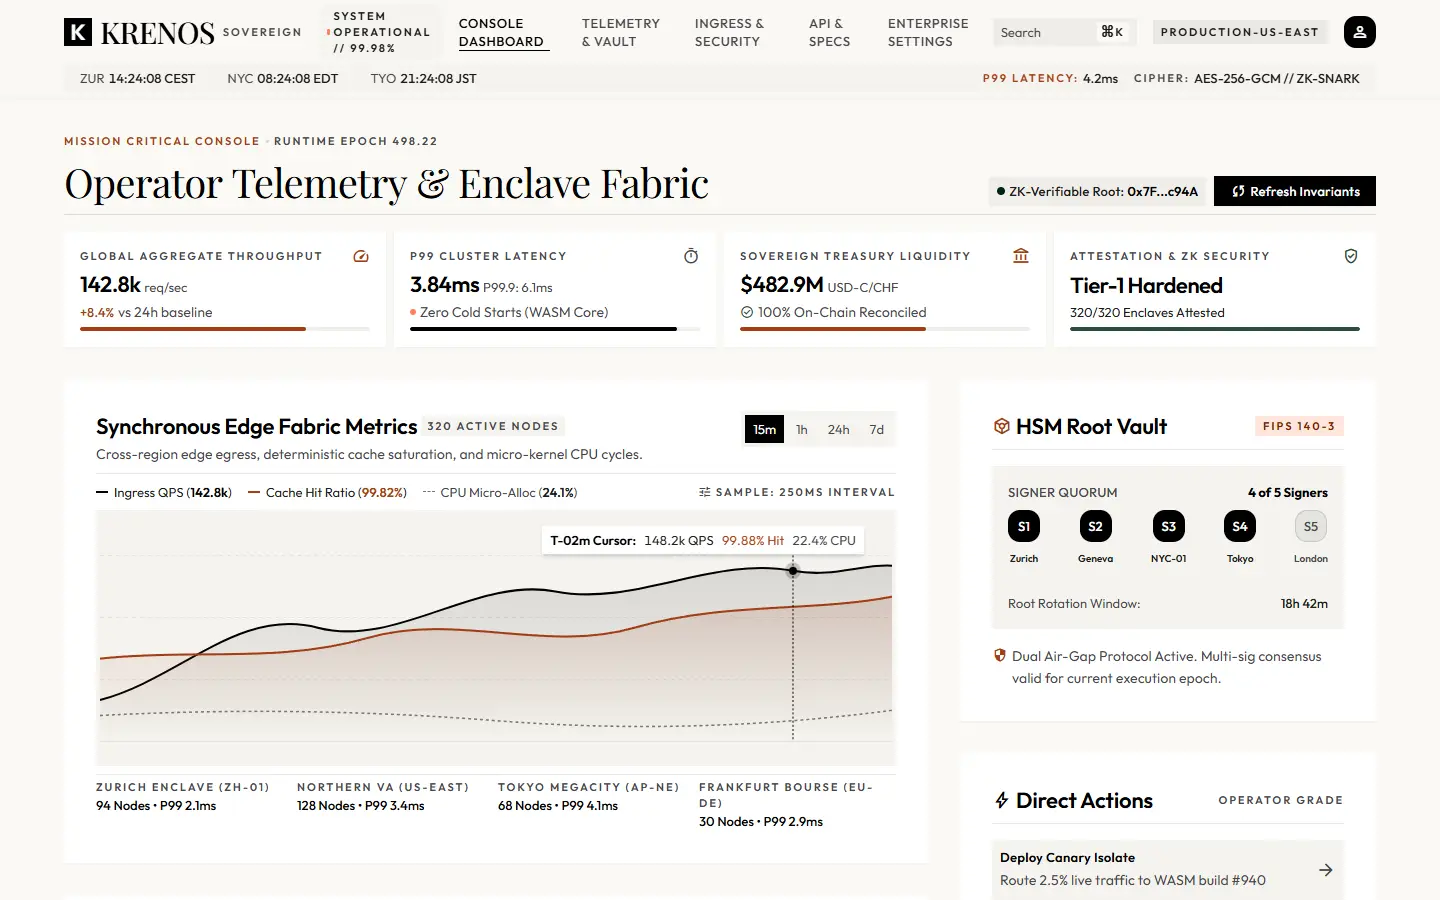
Operator Telemetry is the KRENOS observability dashboard React template. It is a genuine operations interface: KPI cards for throughput, cache efficiency and CPU saturation, a fabric metrics chart that re-plots across four time windows, running pipelines, an append-only ledger stream and a panel of direct actions.
Dense operational screens are the hardest part of a SaaS product to design well, which is what this template exists to give you.
Queries per second, cache hit rate and CPU saturation re-plot across 15m, 1h, 24h and 7d — each window a fixed series, so switching reads as a real re-plot with no randomness.
Moving across the chart reports the value at that point, in text as well as position.
Timestamped events with actor, region, status and hash, refreshing with new rows and advancing the block height.
Running pipelines with memory and throughput, an HSM quorum panel with signers, and action cards that report confirmation feedback.
Every one is a working part of the live template, not a screenshot. Open the demo to use them.
Current epoch and cluster status.
Throughput, cache efficiency and CPU saturation with deltas.
The multi-series chart with its time-window control and readout.
Running workloads with memory, threads and throughput.
The immutable event table with refresh.
Signer quorum across regions.
Operator actions with confirmation feedback.
Standing checks and fabric topology.
Metrics, traces and event streams presented to operators.
Cluster status, pipelines and operational actions in one console.
A platform team’s own console, without designing it from nothing.
No metrics backend, agent or time-series database is included. Refreshes append fixed events in order and advance timestamps arithmetically, so the console behaves consistently offline.
Every KRENOS purchase includes all eleven, so these are alternatives to consider, not add-ons.
KRENOS · Operator Telemetry
The demo is the real template, not a video. It opens with a thin KRENOS bar so you can switch templates, preview it at phone, tablet and desktop widths, or come back to the explorer.